My dissertation advisor kept telling me: “Know the data to be a good macroeconomist.” Data free conversations don’t cut it in macro.
Economagic is great site for getting to know the macro data. Economagic was developed by an economics professor in Alabama to help his students. The idea was to give students easy access to large amounts of data, and to be able to quickly generate charts of that data. There are more than 200,000 time series for which data and customized charts can be retrieved. All the core macro stats that we are going to look at are there, including those on GDP, unemployment, inflation, exchange rates, etc. under the Most Requested Series tab. The site offers most of the data for free, but access to files in Excel, or copy-and-paste format, as well as forecasts is limited to paid subscribers. Hey, you don’t get rich teaching macro!
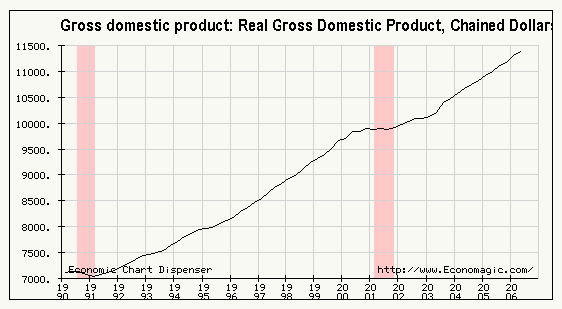
I have generated a chart of the recent path of real Gross Domestic Product (GDP) for the United States in less than a minute using Economagic. Real GDP is the number that macroeconomists use to keep their hand on the pulse of an economy. You’ll be learning a lot, maybe more than you wish to know, about GDP in the course, especially in Chapter 7 of your text.
Extra credit: When real GDP declines for six months or two quarters, what is happening in Macroland? Hint what are the shaded areas on the real GDP graph called? If you are the first student to send me an e-mail (kwoodward@saddleback.edu) with the answer, you will be rewarded with two extra credit Discussion Board points. Only two points extra credit per student can be earned in any given week from the blog questions.
I wish I had access to Economagic when I was doing my dissertation in the 1980's. In many ways the world is getting better.
Economagic is great site for getting to know the macro data. Economagic was developed by an economics professor in Alabama to help his students. The idea was to give students easy access to large amounts of data, and to be able to quickly generate charts of that data. There are more than 200,000 time series for which data and customized charts can be retrieved. All the core macro stats that we are going to look at are there, including those on GDP, unemployment, inflation, exchange rates, etc. under the Most Requested Series tab. The site offers most of the data for free, but access to files in Excel, or copy-and-paste format, as well as forecasts is limited to paid subscribers. Hey, you don’t get rich teaching macro!
I have generated a chart of the recent path of real Gross Domestic Product (GDP) for the United States in less than a minute using Economagic. Real GDP is the number that macroeconomists use to keep their hand on the pulse of an economy. You’ll be learning a lot, maybe more than you wish to know, about GDP in the course, especially in Chapter 7 of your text.
Extra credit: When real GDP declines for six months or two quarters, what is happening in Macroland? Hint what are the shaded areas on the real GDP graph called? If you are the first student to send me an e-mail (kwoodward@saddleback.edu) with the answer, you will be rewarded with two extra credit Discussion Board points. Only two points extra credit per student can be earned in any given week from the blog questions.
I wish I had access to Economagic when I was doing my dissertation in the 1980's. In many ways the world is getting better.

No comments:
Post a Comment