Showing posts with label real GDP. Show all posts

Friday, November 02, 2007

GDP up more than expected


In Chapter 7 of your e-book, you are learning about the main macro measure: gross domestic product or GDP. GDP helps us to measure the performance, speed, and health of the macroeconomy. Looking at the path of real GDP allows us to evaluate our monetary and fiscal policies, our investment and savings patterns, and our material well being.

This week there was good news on the GDP front. The first estimate of third quarter economic growth was better than most economists (including myself) had expected. The Bureau of Economic Analysis reported this week that U.S. real GDP grew at a 3.9% annual rate in the third quarter.
The most common way to calculate GDP is to add up all spending on domestically produced final goods and services, leading to the equation GDP = C+I+G+X-IM. There was good growth in nonresidential fixed investment (I) helping to make up for the weakness in housing. There was also good growth in exports (X) because of the weak dollar. I am still trying to figure out why consumer spending grew at three percent! Government purchases grew by 3.7 percent at annualized rate almost entirely because of defense spending growth.

Click here for a sample of the reactions of various economists to the latest GDP report, and here for a detailed analysis of the GDP picture. Anyway if GDP growth is so could why did the Fed feel the need to cut interest rates this week? Do they know something that isn’t in the stats?

Extra Credit: Why does the BEA Press Release refer to real GDP? Is there a fake GDP? Explain. How much did the GDP deflator rise in the third quarter? If you are the first student to send me an e-mail (kwoodward@saddleback.edu) with the answer, you will be rewarded with two extra credit Discussion Board points. Only two points extra credit per student can be earned in any given week from the blog questions.

Friday, February 02, 2007

News of the Week from Macroland


One primary focus of Econ 2 online is to explain what causes macro numbers such as the GDP, unemployment rate, inflation, interest rates, exchange rates, etc., to go up and down (positive economics). Recent economic indicators have been mixed

This week there was a glut of news about the state of the overall economy. On Tuesday the government reported the economy’s GDP (Chapter 7) grew at a healthy 3.5% annual rate in the fourth quarter of 2006. A surge in consumer spending, helped by falling energy prices, boosted GDP growth.

Not long after that the Federal Reserve (Chapter 12) left the target for short-term interest rates at 5.25% for the fifth consecutive meeting. In a statement released after their meeting, the Federal Reserve Open Market Committee (FOMC) seemed more optimistic about both growth and inflation than the last time that it met in December. The central bank said its major concern is in the firs part of 2007 is inflation.

On Thursday, February 1, the Commerce Department announced the personal savings rate for American households for 2006. It wasn’t pretty. The personal savings rate is at its lowest level since the Great Depression of the 1930’s.


Finally, today on Friday, we got the Employment Situation Summary or jobs report for the economy. Overall we saw job modest growth in January, but things weren't so great in the manufacturing sector. Employers added 111,000 jobs to payrolls last month, according to the Labor Department report, down from a revised 206,000 jobs in December.
Extra Credit:
Today there are two extra credit questions. Answer only one if you are interested in earning extra credit.

1. What was the personal savings rate for all of 2006? What does this mean for our economy?

2. What was the overall unemployment rate in January 2007? Is the unemployment rate going up or down?

If you are the first student to send me an e-mail to kwoodward@saddleback.edu) with the answer to one of the questions, you will be rewarded with two extra credit Discussion Board points. Only two points extra credit per student can be earned in any given week from the blog questions.
Monday, October 16, 2006

Macro Magic


My dissertation advisor kept telling me: “Know the data to be a good macroeconomist.” Data free conversations don’t cut it in macro.

Economagic is great site for getting to know the macro data. Economagic was developed by an economics professor in Alabama to help his students. The idea was to give students easy access to large amounts of data, and to be able to quickly generate charts of that data. There are more than 200,000 time series for which data and customized charts can be retrieved. All the core macro stats that we are going to look at are there, including those on GDP, unemployment, inflation, exchange rates, etc. under the Most Requested Series tab. The site offers most of the data for free, but access to files in Excel, or copy-and-paste format, as well as forecasts is limited to paid subscribers. Hey, you don’t get rich teaching macro!

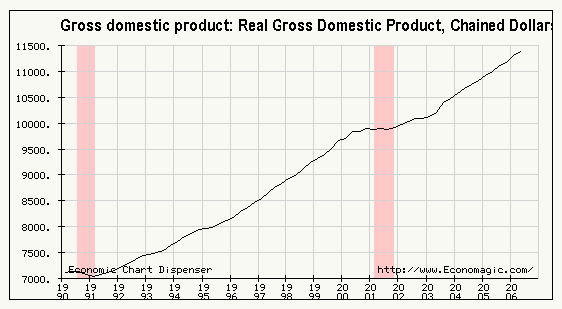
I have generated a chart of the recent path of real Gross Domestic Product (GDP) for the United States in less than a minute using Economagic. Real GDP is the number that macroeconomists use to keep their hand on the pulse of an economy. You’ll be learning a lot, maybe more than you wish to know, about GDP in the course, especially in Chapter 7 of your text.

Extra credit: When real GDP declines for six months or two quarters, what is happening in Macroland? Hint what are the shaded areas on the real GDP graph called? If you are the first student to send me an e-mail (kwoodward@saddleback.edu) with the answer, you will be rewarded with two extra credit Discussion Board points. Only two points extra credit per student can be earned in any given week from the blog questions.

I wish I had access to Economagic when I was doing my dissertation in the 1980's. In many ways the world is getting better.